1、创建网站

2、增加伪静态
thinkphp 5.0, 5.1 的 nginx伪静态规则:
if (!-e $request_filename) {
    rewrite  ^(.*)$  /index.php?s=/$1  last;
    break;
}
thinkphp 3.2 的nginx伪静态规则:
if (!-e $request_filename) {
    rewrite ^(.*)$ /index.php?s=$1 last;
    break;
}
然后重启nginx服务。
3、修改php配置文件( php.ini)
[Xdebug]
zend_extension=D:/Data/phpstudy_pro/Extensions/php/php7.3.4nts/ext/php_xdebug.dll
xdebug.trace_output_dir=D:/Data/phpstudy_pro/Extensions/php_log/php7.3.4nts.xdebug.trace
xdebug.profiler_output_dir ="D:/Data/phpstudy_pro\Extensions\tmp\xdebug"
xdebug.remote_enable=On
xdebug.profiler_enable=Off
xdebug.profiler_enable_trigger=Off
xdebug.profiler_output_name=cachegrind.out.%t.%p
xdebug.show_local_vars=0
xdebug.idekey="PHPSTORM"
xdebug.remote_autostart=on
xdebug.remote_port=9100
xdebug.collect_params=1
xdebug.collect_return=1
xdebug.auto_trace=Off
xdebug.remote_host=localhost
xdebug.remote_handler=dbgp
特别注意(根据自己的配置进行修改):
zend_extension=D:/Data/phpstudy_pro/Extensions/php/php7.3.4nts/ext/php_xdebug.dll
xdebug.trace_output_dir=D:/Data/phpstudy_pro/Extensions/php_log/php7.3.4nts.xdebug.trace
xdebug.profiler_output_dir ="D:/Data/phpstudy_pro\Extensions\tmp\xdebug"
xdebug.remote_port=9100 我把监听端口设置为9100
xdebug.idekey="PHPSTORM"  把IDE KEY设置为 PHPSTORM
4、配置PHPStorm
4.1 配置PHP debug

4.2 配置RUN/Debug Configurations
点击工具栏 配置 Edit Configurations..

弹出窗口中,点击 + 号, 点击添加 PHP Remote Debug

弹出窗口 Run/Debug Configurations 配置 Configuration > Filter debug connection by IDE key 前面打勾,
选择一个Server, 没有 Server的话 点击右边的 ... 按钮, 添加一个 Server

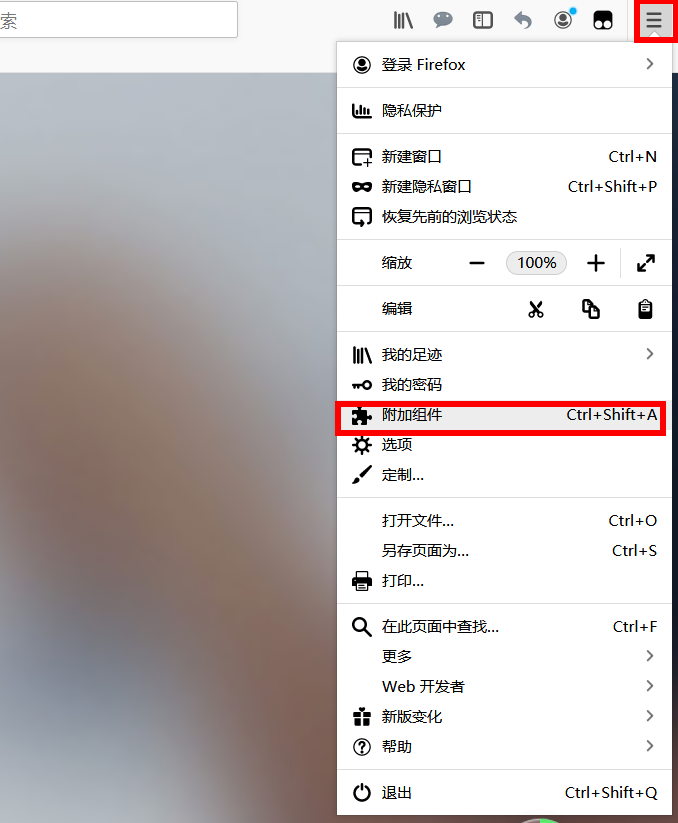
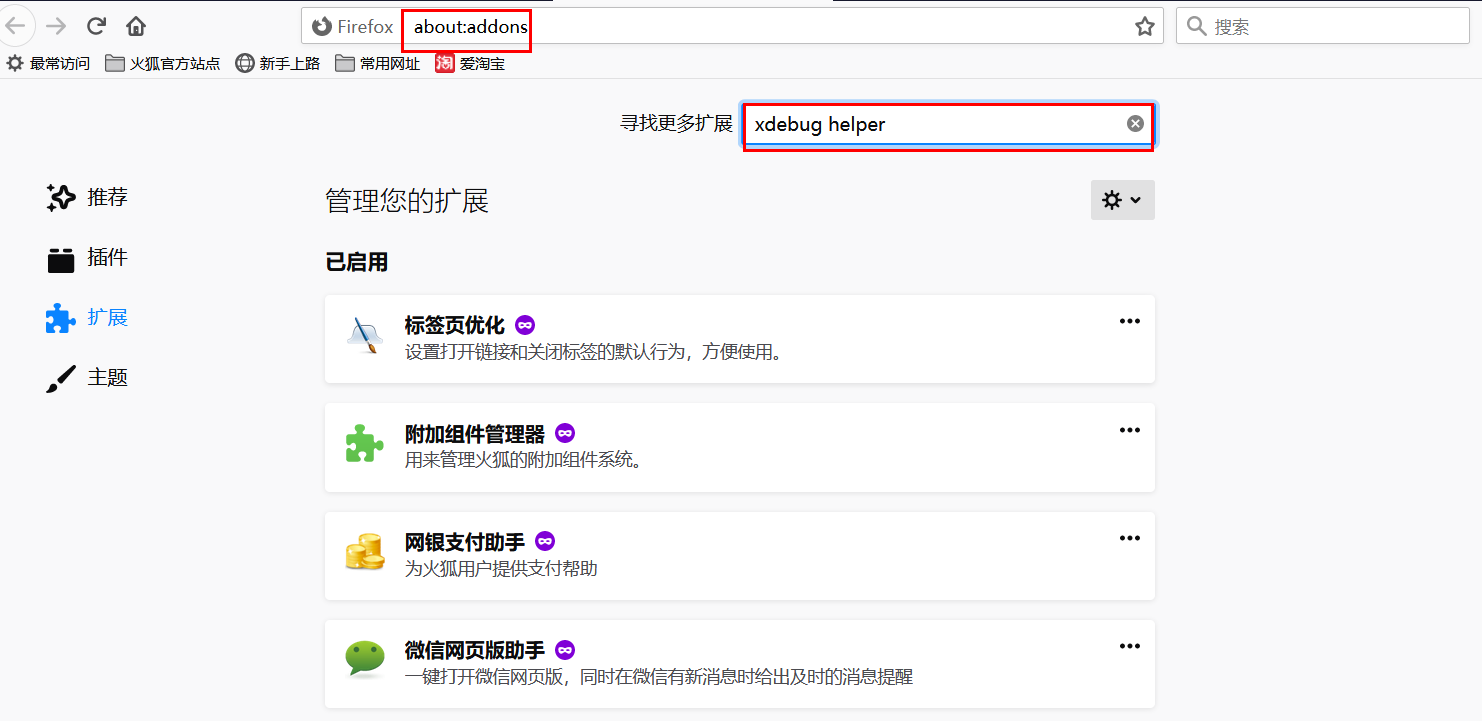
** 安装浏览器Debug拓展:**
1. Firefox火狐浏览器
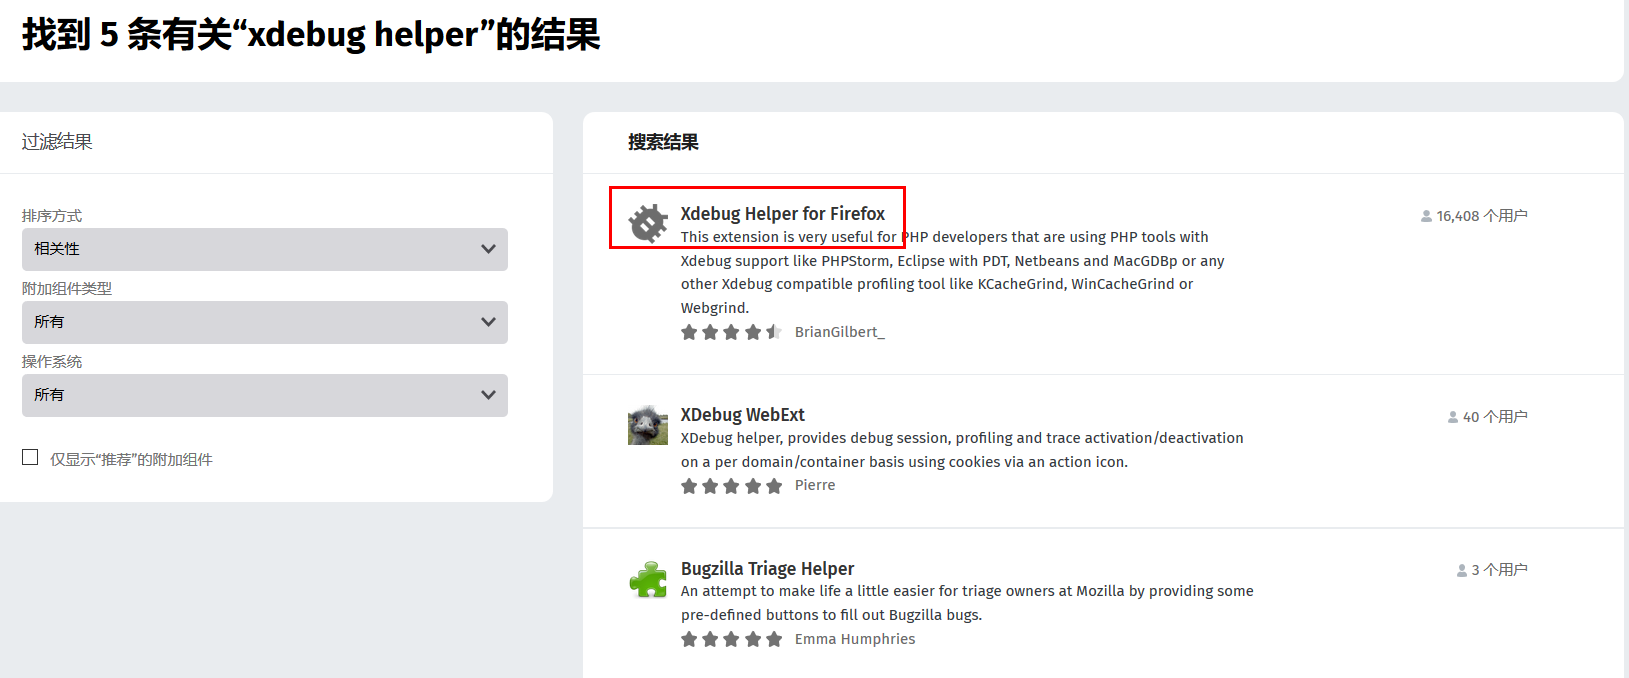
安装 Xdebug Helper for Firefox 拓展:
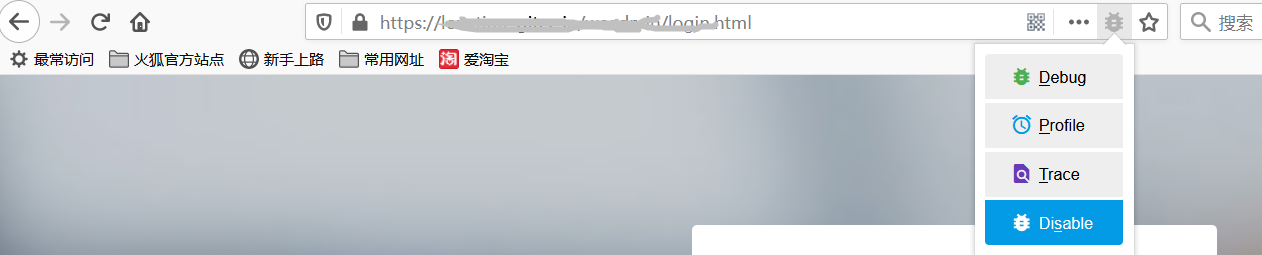
拓展安装完成后,就会多出一个debug按钮:
2. Chrome谷歌浏览器
到谷歌应用商店: https://chrome.google.com/webstore/category/extensions?hl=zh-CN 搜索安装 Xdebug helper 拓展:
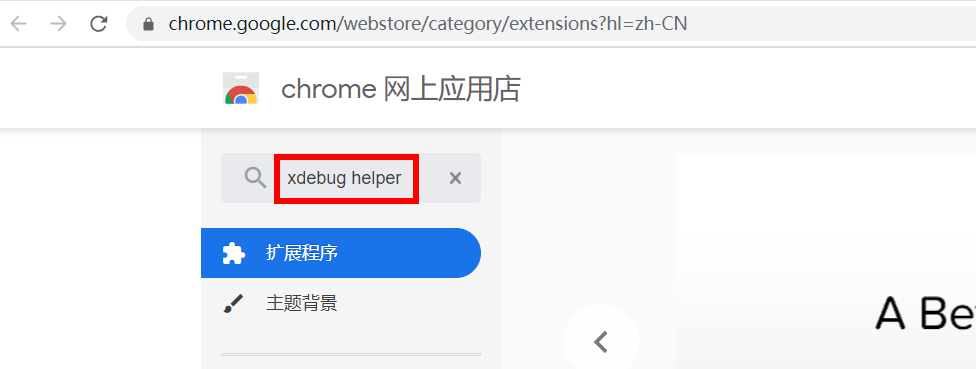
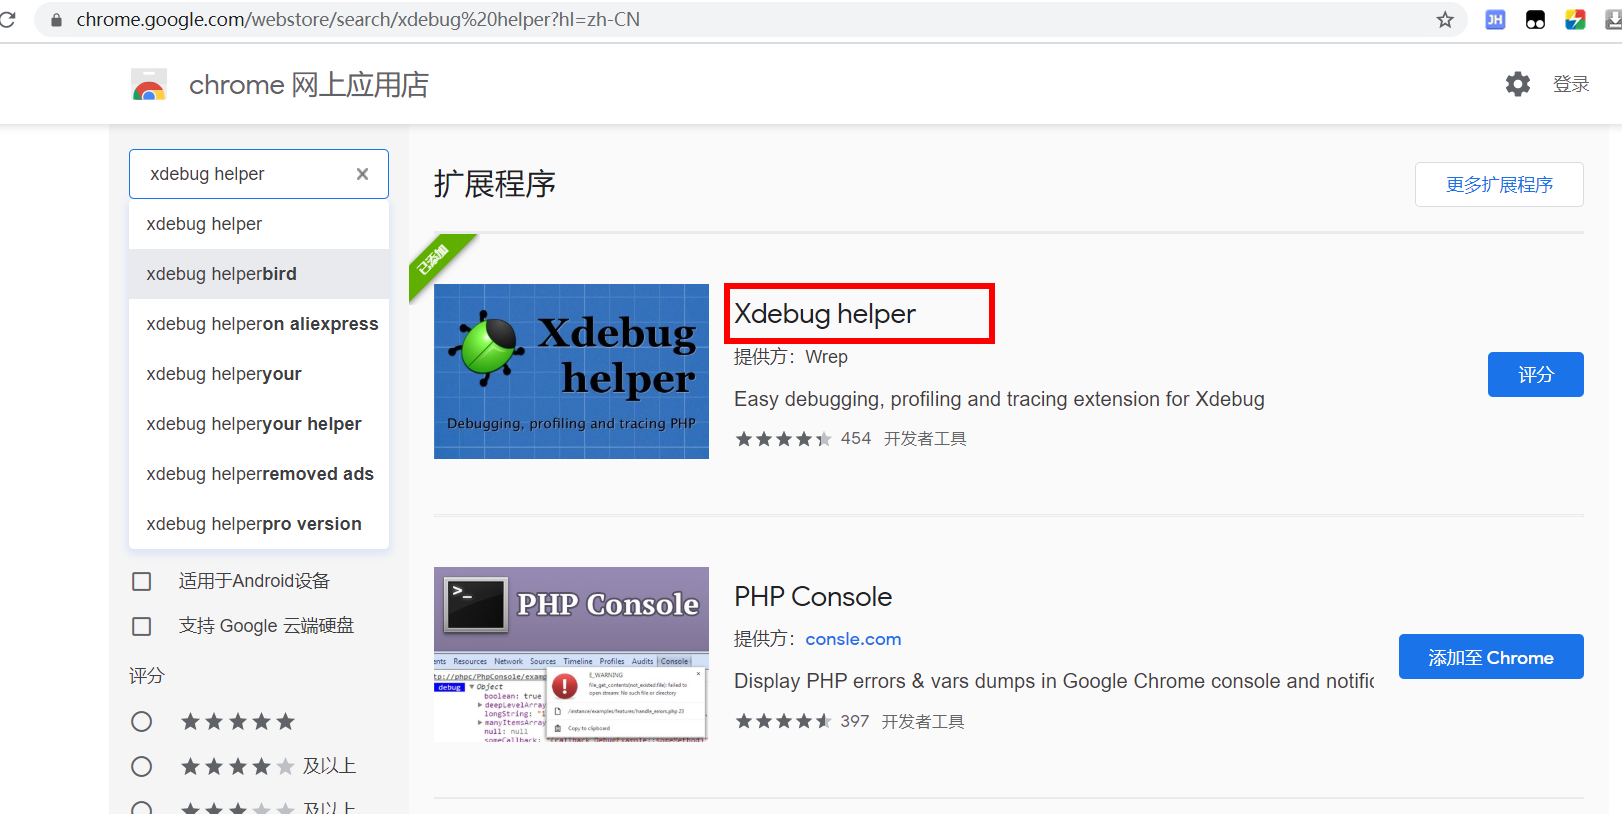
输入 xdebug helper 然后按Enter回车健, 出现结果的第一条就是我们要安装的拓展:
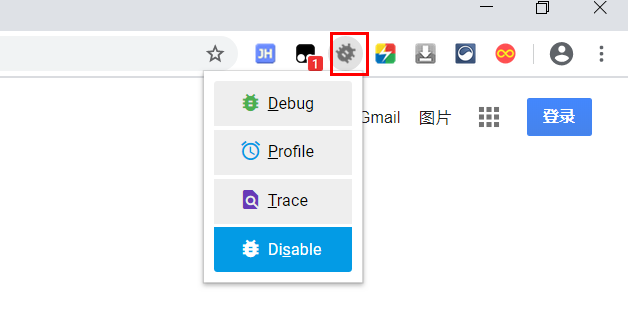
安装完成后,就会出现Debug按钮:
XDebug调试的一些按钮功能:
F7 通过当前行,进入下一行,如果该行是方法,则进入方法体
F8 通过当前行,进入下一行,如果该行是方法,也直接进入下一行,不进入方法体
F9 通过整个流程,全部顺序执行,除非遇到下一个断点
F8 step over 步越 执行当前函数的下一步,如果有子函数,也不会进入,会一直执行到函数结束
F7 step into 步入 执行当前函数的下一步,如果有子函数,会从头到尾执行子函数,还原了程序执行的最详细的路线,从构造函数到结尾的每一步都会跳到。
Alt + Shift + F7 force step into 与 step into 相同,执行当前函数的下一步,如果有子函数也会进入子函数,只不过不会从头到尾的还原函数执行的路线,会直接跳到子函数内第一步,构造函数等一些前置方法会忽略
Shift + F8 step out 步出 跳出当前执行的函数,跳到父函数的下一步。
Alt + F9 run to cursor 执行到下一个断点处